Carbon reduction methodology
For the Responsible Balanced Fund and Responsible Choice Model Portfolios
Carbon reduction calculation
The methodology 7IM uses is recommended by the TCFD (Task Force on Climate-related Financial Disclosures) where the portfolio aggregated figure is calculated based on an equity ownership approach. For example, if an investor owns 2% of the company, then the investor also owns 2% of the company’s carbon emissions.
Adjusted coverage aggregation
Due to data issues in fixed income and problems with apportioning ownership to fixed income holdings, this method focuses on equity ownership. To allow a fair comparison against the global equity index, we use Bloomberg’s coverage adjusted approach to scale up equities’ carbon footprint in each portfolio.
Calculation
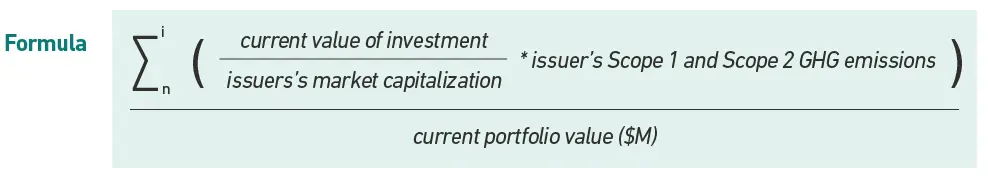
The following steps summarise the calculation of the aggregate “Carbon Emissions – Scope 1 and 2 in metric tons” for a portfolio.
Step 1
We retrieve the following data points from our risk management system bi-annually:
- Weight (%)
- Market Value
- Market Capitalisation
- Carbon Emissions – Scope 1 and 2 in metric tons
Step 2
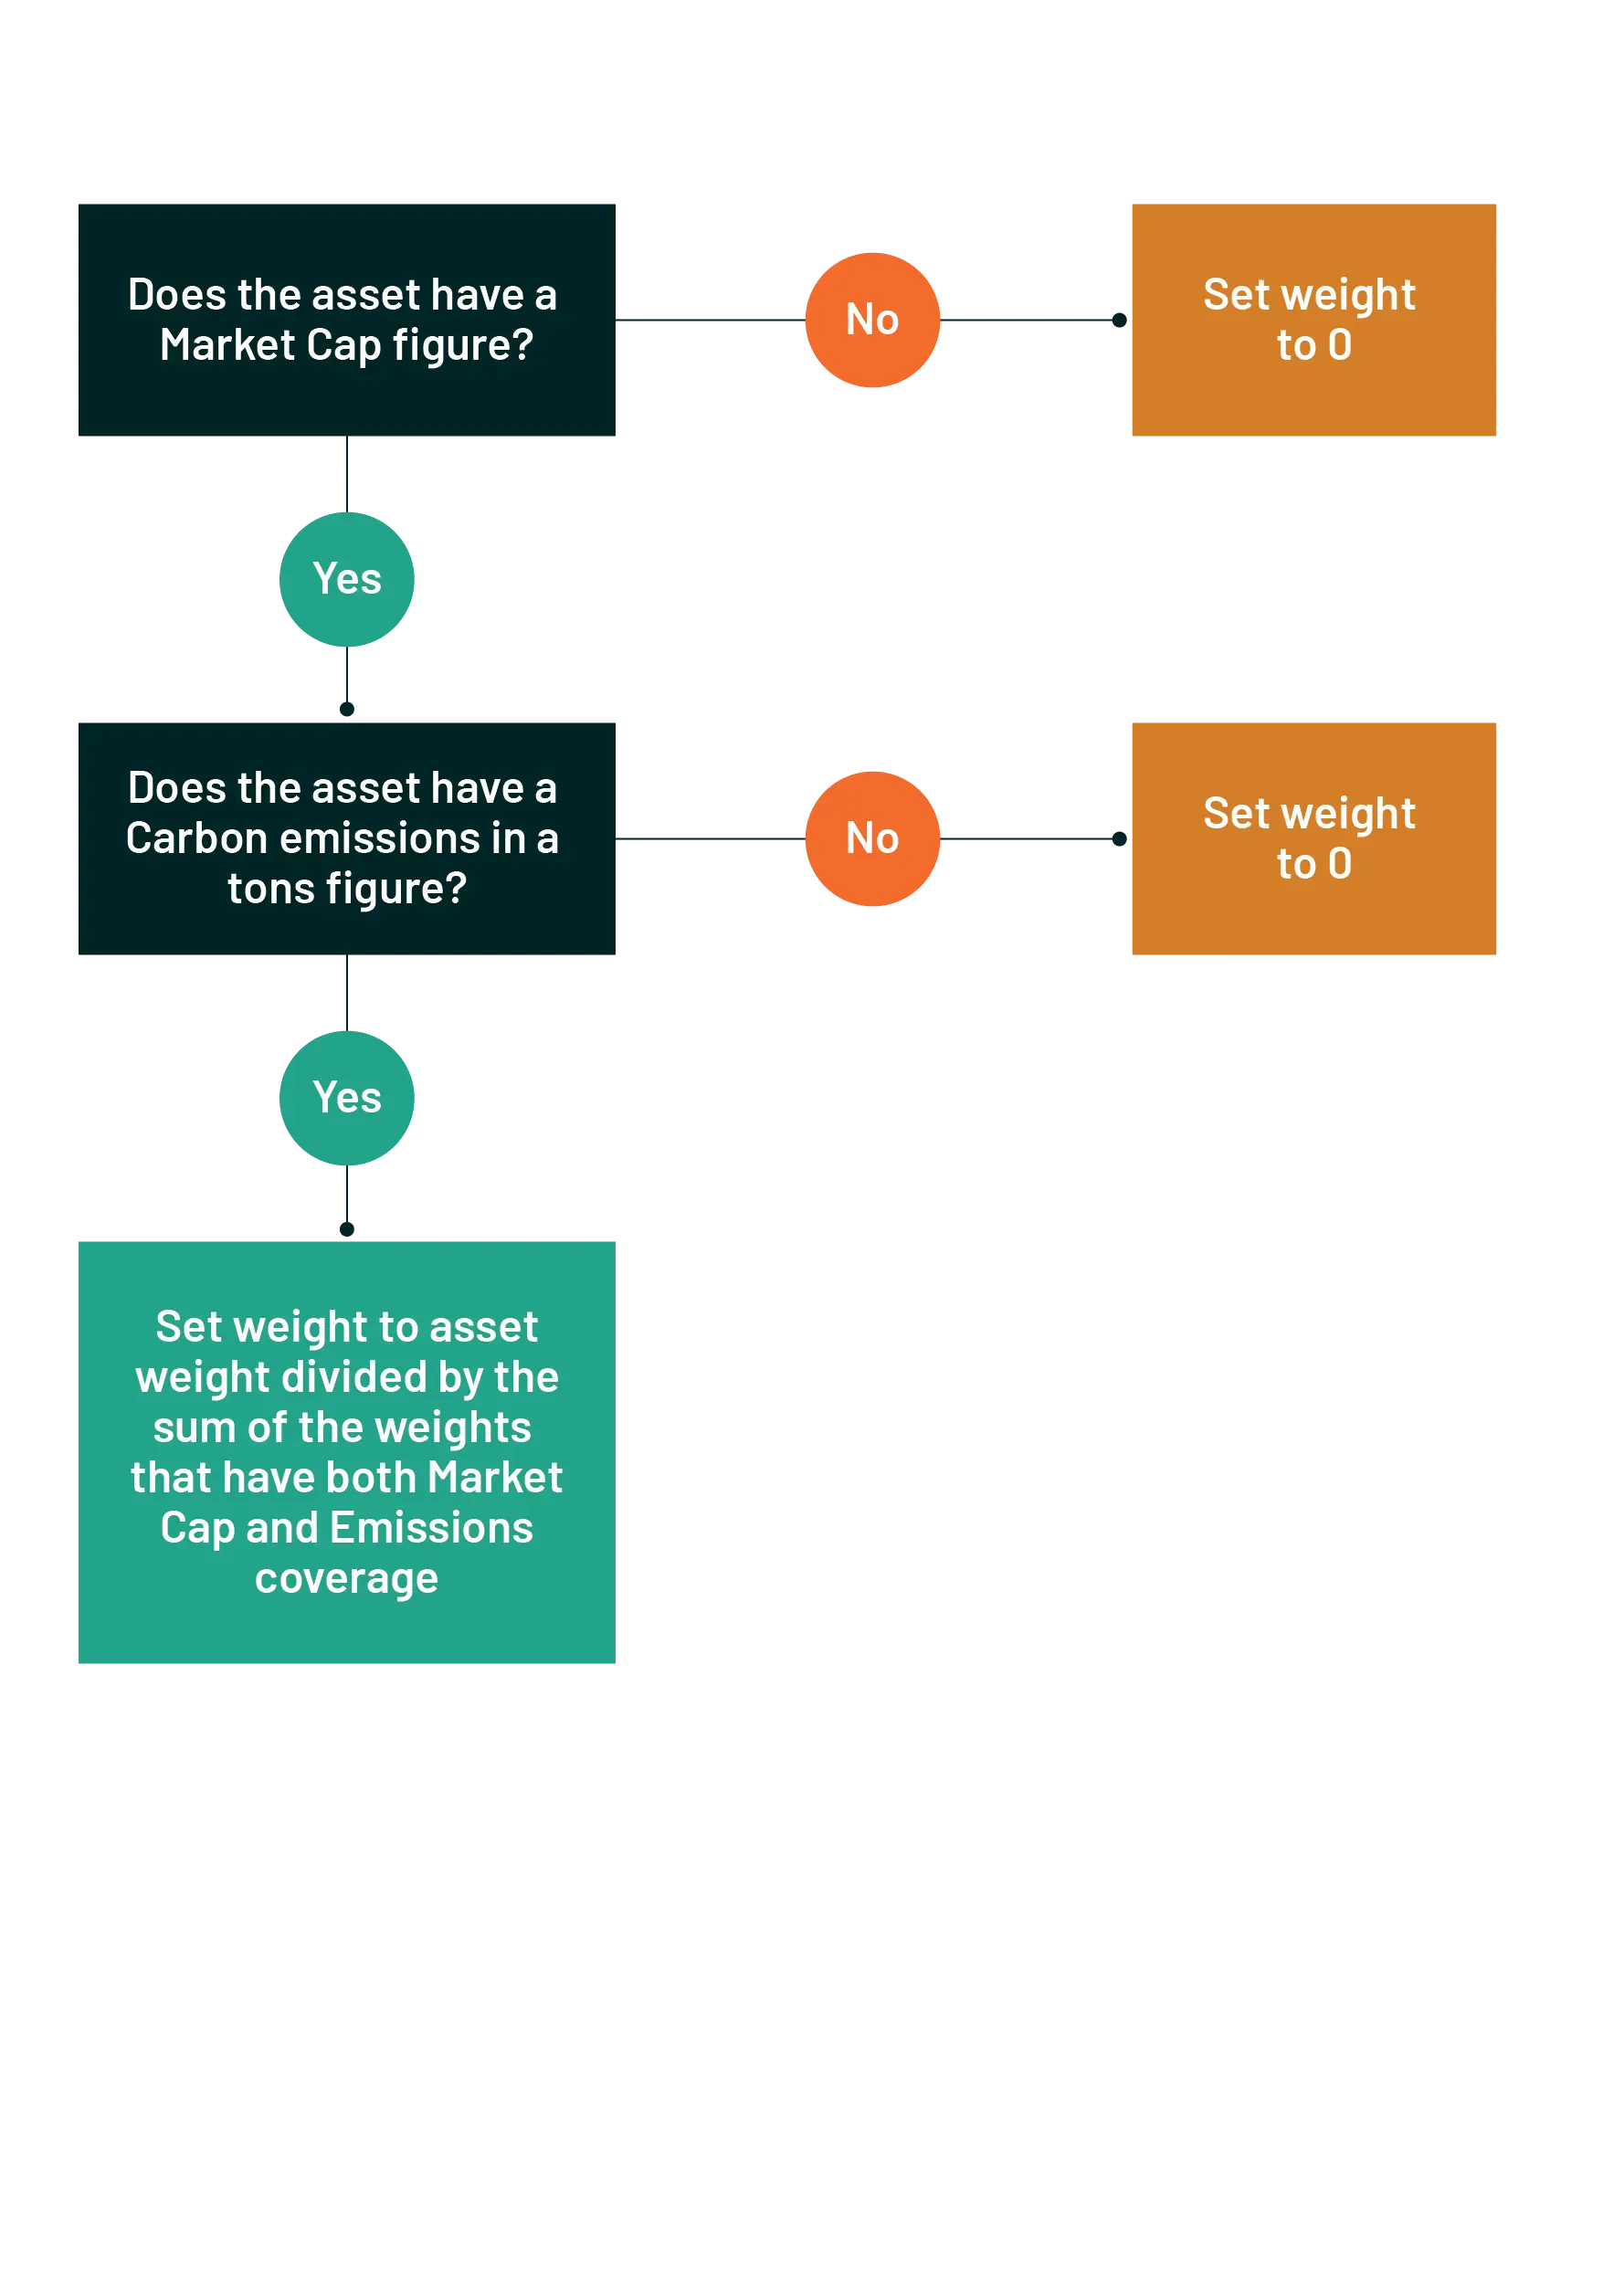
Filter assets and adjust the weight based on coverage using the following steps
Step 3
Multiply coverage adjusted weights by total portfolio market value and obtain coverage adjusted market value for each asset in the portfolio
Step 4
Divide coverage adjusted market value of each asset by the market capitalisation of each asset and obtain investor allocation on each asset
Step 5
Multiply investor allocation of each asset in the portfolio by the carbon emissions of each asset and obtain ownership of carbon emissions in each asset. Finally, sum ownership weighted carbon emissions in each asset to calculate the total carbon emissions generated by investing XYZ (total portfolio market value) in the portfolio
Step 6
Once we have the portfolio level approximation for carbon emissions scope 1 and 2 metric tons, we will source carbon emission figures for the everyday activities shown in the calculator. For example, airlines usually give estimates of carbon emissions for travel destinations, and you may have even noticed carbon figures the last time you booked a flight.
Step 7
We then divide the portfolio figure by the activities figures to get the amounts shown in the calculator.
Example portfolio data
| Holding type | Portfolio weight % | Portfolio market value £ | Issuer market cap £ | Carbon emissions in metric tons | Coverage adjusted weight % | Coverage adjusted market value £ (Step 3) | Investor allocation % (Step 4) | Investor allocation of carbon emissions in metric tons (Step 5) |
|---|---|---|---|---|---|---|---|---|
| Equity A | 10 | 10,000,000 | 500,000,000 | 100,000 | 20 | 20,000,000 | 4.0 | 4,000 |
| Equity B | 10 | 10,000,000 | 1,250,000,000 | 500,000 | 20 | 20,000,000 | 1.6 | 8,000 |
| Equity C | 10 | 10,000,000 | 750,000,000 | 25,000 | 20 | 20,000,000 | 2,7 | 667 |
| Equity D | 10 | 10,000,000 | - | - | - | - | - | - |
| Equity E | 10 | 10,000,000 | 500,000 | 5,000,000 | 20 | 20,000,000 | 4.0 | 200,000 |
| Equity F | 10 | 10,000,000 | 2,500,000,000 | 2,000,000 | 20 | 20,000,000 | 0.8 | 16,000 |
| Fixed Interest G | 10 | 10,000,000 | - | - | - | - | - | - |
| Fixed Interest H | 10 | 10,000,000 | - | - | - | - | - | - |
| Fixed Interest I | 10 | 10,000,000 | - | - | - | - | - | - |
| Fixed Interest J | 10 | 10,000,000 | - | - | - | - | - | - |
| Portfolio totals - Where applicable | 100 | 100,000,000 | - | - | - | - | - | 228,667 |
Conclusion
By following the methodology explained above we obtain the following figures for the Responsible Balanced Fund and the Responsible Choice Model Portfolios as at 12 October 2025:
| 7IM Portfolio | Emissions in metric tons adjusted per £1,000,000 invested |
|---|---|
| Responsible Balanced Fund | 31.54 |
| Responsible Choice Cautious Model | 35.71 |
| Responsible Choice Moderately Cautious Model | 36.74 |
| Responsible Choice Balanced Model | 40.61 |
| Responsible Choice Moderately Adventurous Model | 40.93 |
| Responsible Choice Cautious Model Adventurous | 36.74 |