
A (more) golden age for investors and savers
Every year we refresh our capital market assumptions for the major asset types that make up our strategic asset allocations.
These assumptions create guidelines for the risk and return characteristics we can expect from each of these asset types. Although these do not factor directly into the process for building our long-term portfolios (our Strategic Asset Allocations), they can be seen as important inputs to how investors use the portfolios we build.
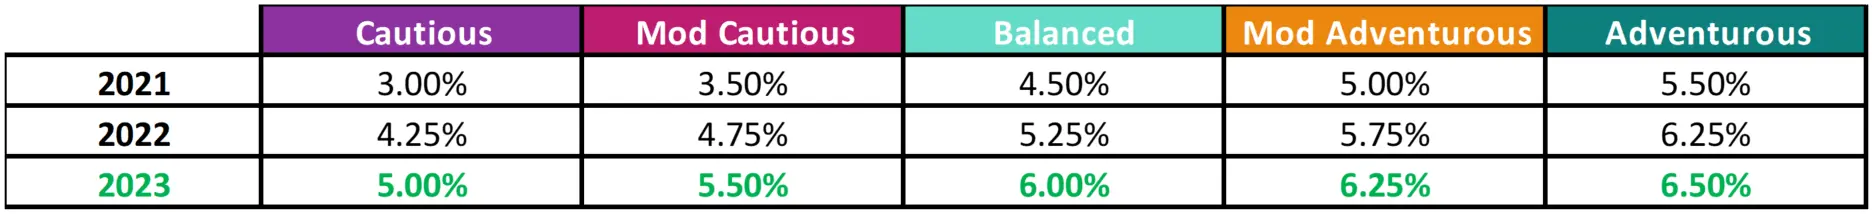
In recent years, the guideline returns for portfolios have moved markedly higher. A variety of factors, not least the normalisation in bond markets and higher interest rates, have seen the long-run guideline returns for many underlying assets increase, which drive the portfolio level results.
The return increase has been most acutely felt by the portfolios we build for lower-risk categories of client. Those profiles tend to be those with largest exposure to bonds. For example, a Moderately Cautious portfolio’s 20-year return is now projected to be a full 2% higher than just a couple of years ago.
Source: 7IM
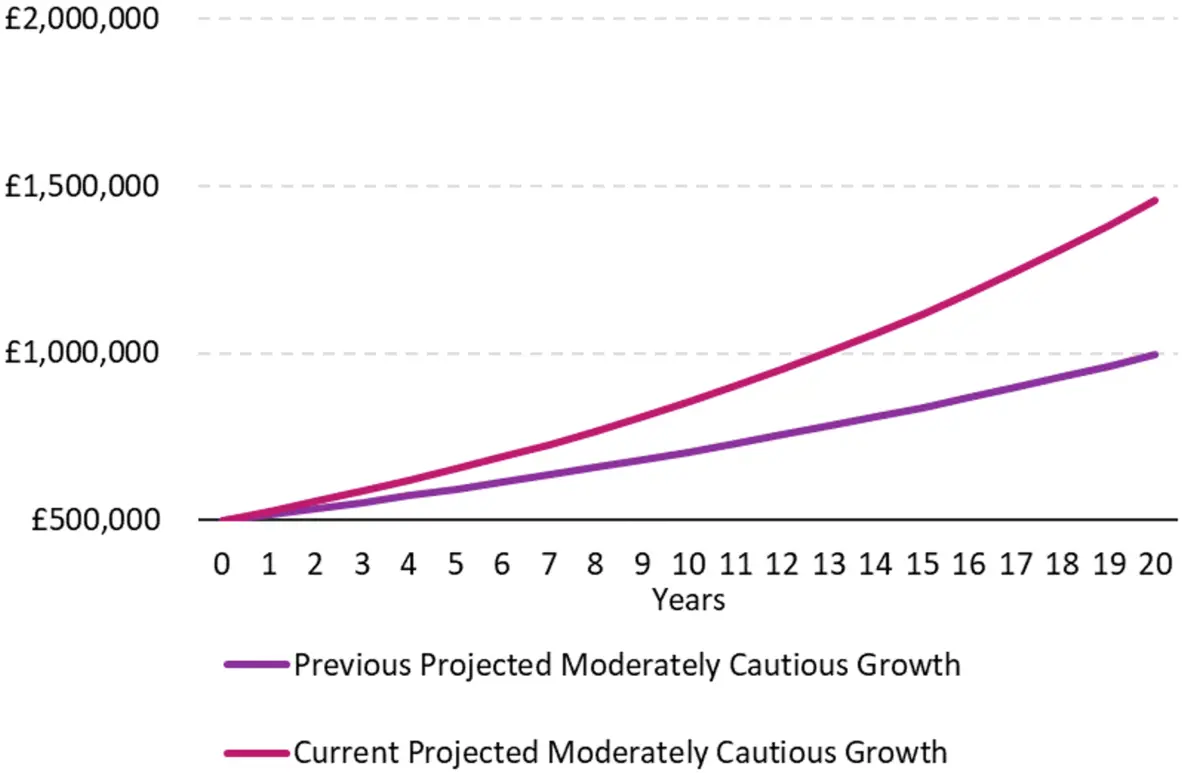
The impact of this change on goals is material when you consider that we are building our guideline returns over a long-term horizon of 20 years. Take, for instance, the Moderately Cautious profile. A £500,000 investment at the previous (2021) growth rate, of 3.5%, for 20 years could generate a projected growth to £1,000,000. However, the new portfolio returns of 5.5% result in significantly higher terminal values. In 2023, with a terminal value of nearly £1,500,000, the growth component of returns is almost double that of the portfolio with a 3.5% return.
This is a simple example, but it shows the power of compounding in action. With the increase in guideline returns we’ve seen for portfolios, this power has tilted further in the favour of investors. It shows that even a modest pick-up in returns, at least in absolute returns, can be significant and important for those investing towards their long-term goals. Portfolios have seen that pick-up in recent years.
Source: 7IM
What about cash?
One of the factors driving our guideline returns higher is a higher return on cash. The investment markets (as indicated by the Bank of England) expect UK savers to enjoy higher cash interest rates than they have been used to over the coming period before interest rates begin to fall next year. With this in mind, do investors need to invest at all?
History would suggest for their long-term goals they are very much better off by investing in diverse portfolios, rather than simply cash. Looking at nearly 100 years of data from the US1, our next chart shows the likelihood of a cash investor being better off than a multi-asset or stock market investor over various time frames.
Percentage chance of investment beating cash
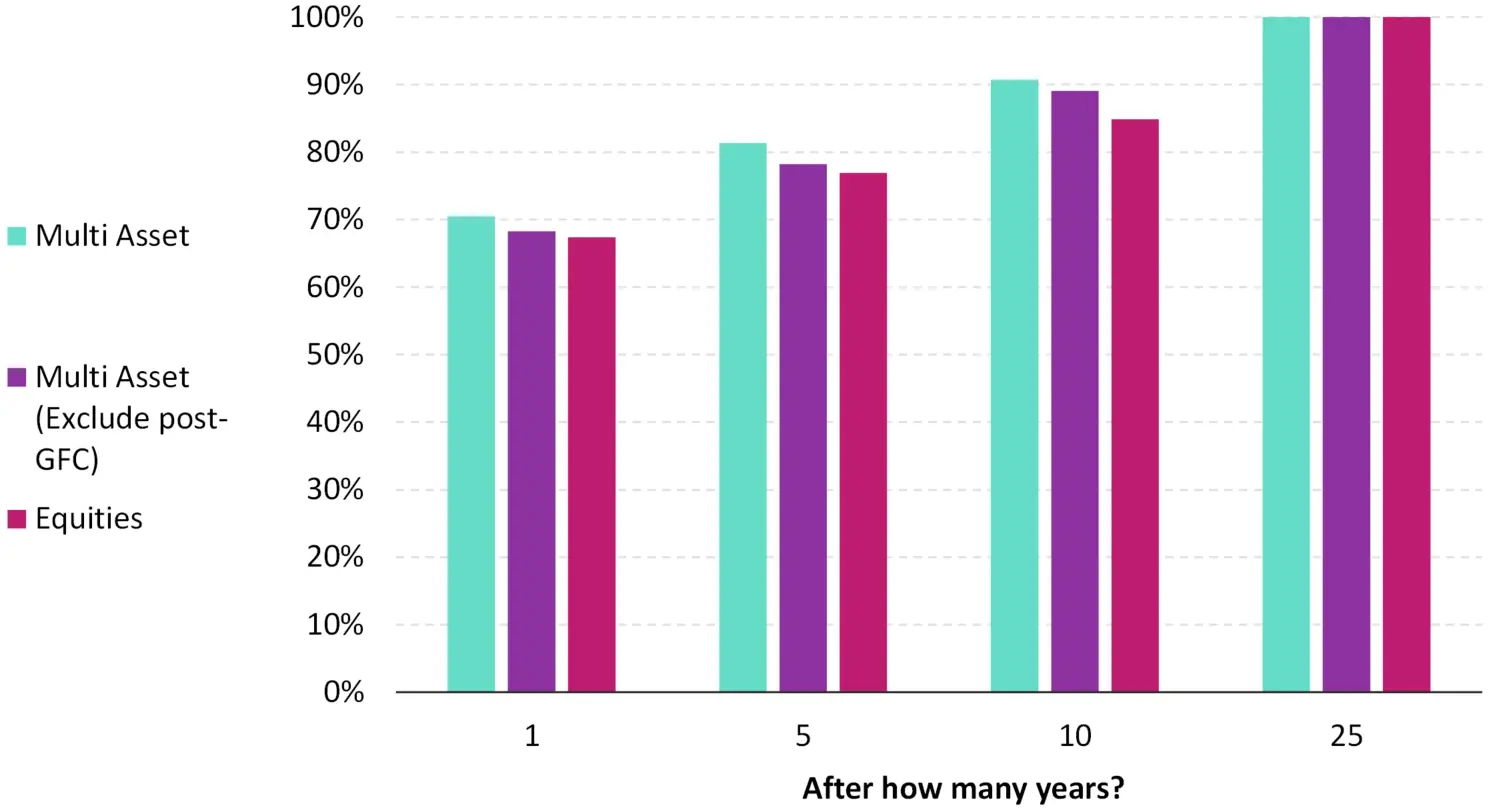
Source: 7IM, NYU Stern/ US Federal Reserve historical return dataset
The light purple bars show that historically a multi-asset portfolio is around 70% likely to outperform cash over one year. However, as we increase the time horizon, this progressively increases, partly due to the power of compounding on the extra returns over the time horizon that’s relevant for investors. Even if we cut out the period since 2008, which has seen lower cash rates that would be favourable to multi-asset portfolios (the light green bars), we get the same picture! Over the sort of horizon investors often take in our portfolios - 25 years or more - cash investors have never been better off than multi-asset investors in terms of the returns they have enjoyed.
Taking the same compounding principal, the next chart looks at the potential impact of the cash versus multi-asset decision. It does so not in % likelihood terms but in £ impact. The long-run (20 year) cash return available in the market today is something like a full 1% or more lower than the current market available rates2, due to the expectation the bank rate will come down in the future as mentioned earlier. This is itself 1-1.5% lower than the return expected on the Moderately Cautious risk profile. At the end of the 20-year period, the final investment pot is over 25% larger, in this case nearly £600,000. Higher-risk profiles would yield even more compelling results. Incremental returns really do matter.
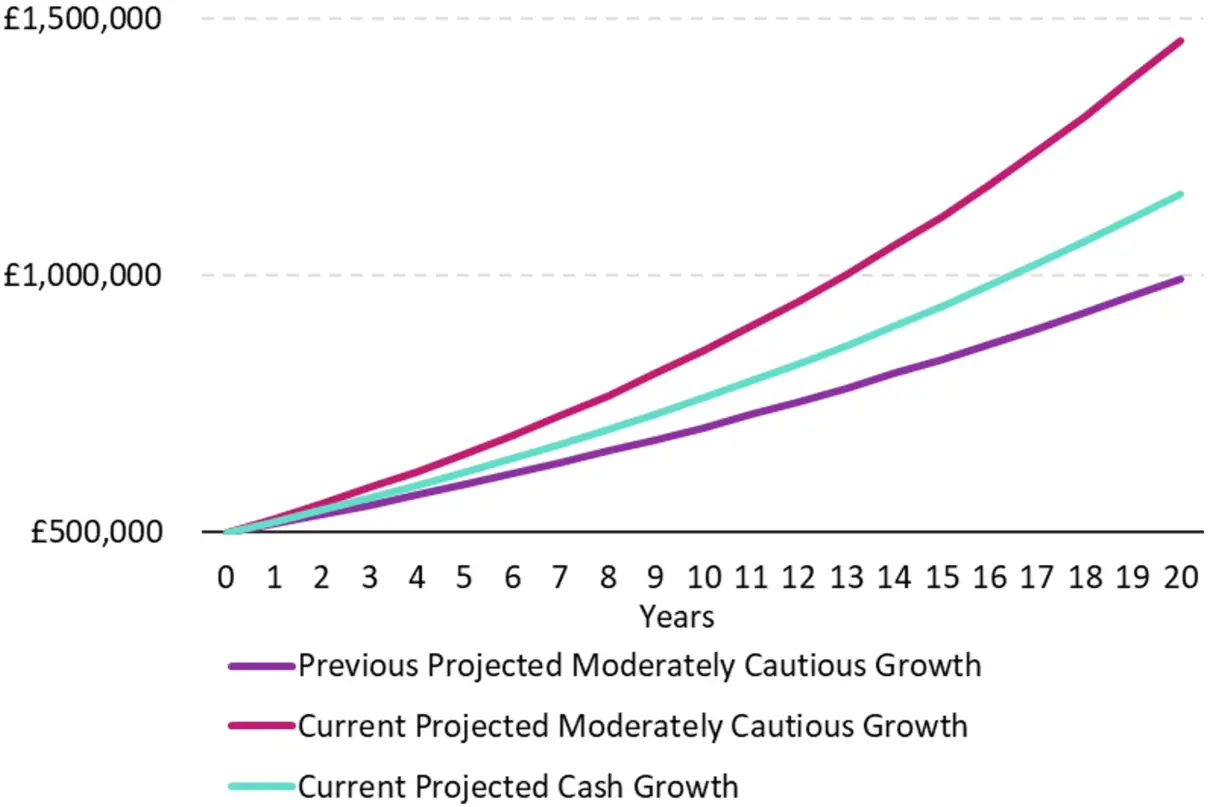
Source: 7IM
This is just one example, but the long-term history paints a similarly favourable picture. Building on our previous example using long-term US data, the table below looks at the average underperformance of cash whilst exemplifying how our multi-asset portfolio has outperformed. As the time horizon increases, so does the size of this outperformance to quite extreme levels. Multi-asset portfolios outperform cash on average by nearly 7% over one year but cumulatively nearly 100% in return terms over 10-year horizons. This, again, is the power of compounding small differences in action!
How much does a cash investor underperform a multi-asset portfolio on average?
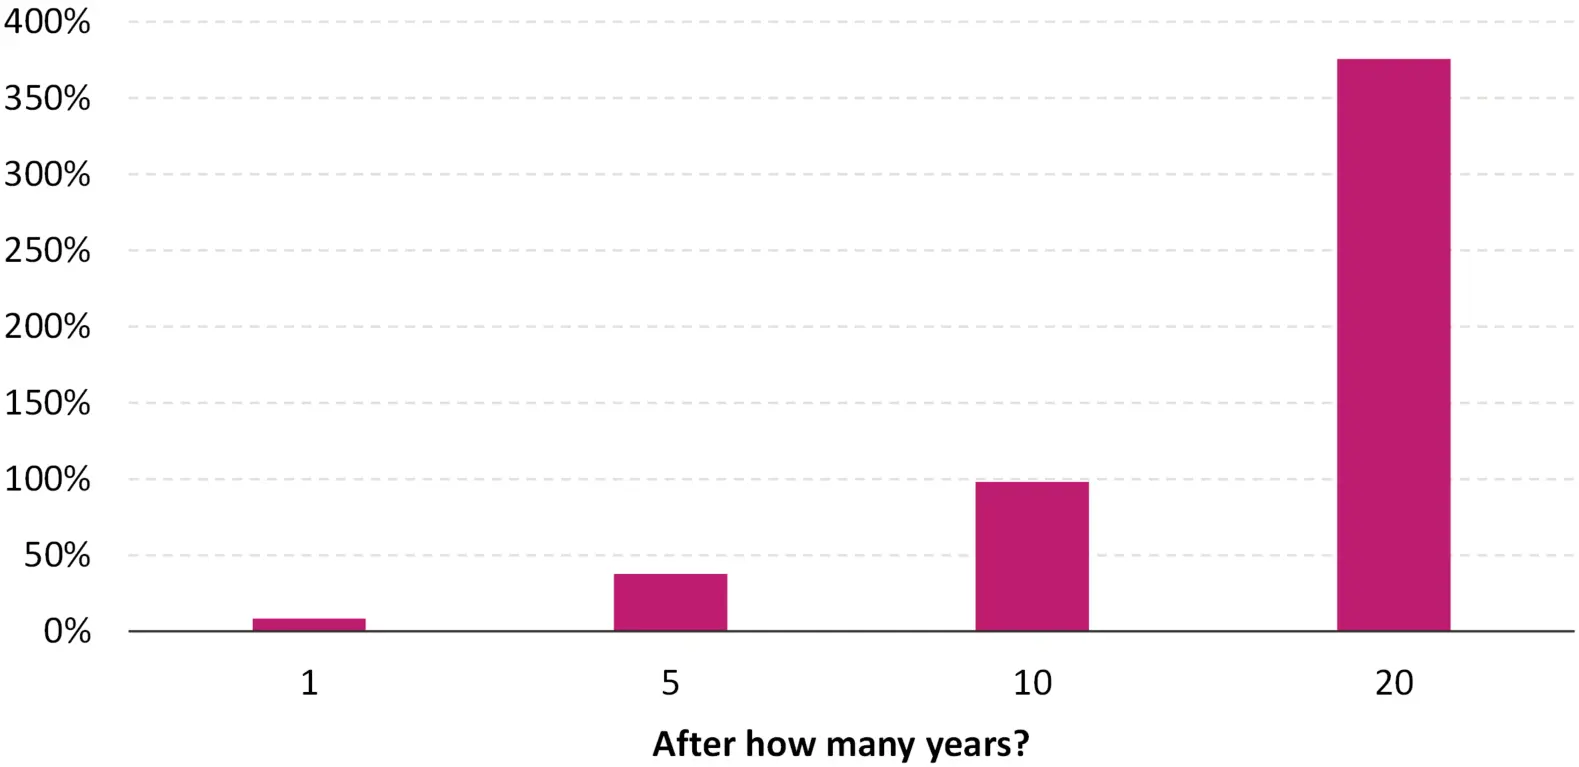
Source: 7IM, NYU Stern/ US Federal Reserve historical return dataset
A Golden age
Central banks the world over have increased interest rates in recent years to counter rising inflation. The mechanism by which this works is to encourage saving and investing, rather than borrowing. This has been a major driver of the higher expected returns we’ve seen in our capital market assumptions process and, subsequently, higher portfolio return expectations.
Fundamentally, investment markets work by looking to reward the incremental risk investors take. By taking risk in equities, or bonds issued by companies, investors should expect a pick-up over the base level of interest rates they could earn in risk-free, cash accounts over the same period. This also flows through into how corporates make decisions in the higher interest rate world. Higher interest rates mean they need to look for higher value-add projects to be worth the interest costs they have to pay. Although this doesn’t change return profiles overnight, over long-run horizons it’s what drives higher growth rates. These are the horizons that matter to most multi-asset investors.
Undoubtedly for very short-term needs there are compelling options for cash investments, much more than in recent years. Higher interest rates have also created opportunities in products that lock up capital indefinitely in return for income for life (so-called annuities). All this creates a wealth of options for discussions around future savings and investments with your adviser.
After years of lower returns and fewer options, there’s much more to discuss. However, hopefully as some of the data we’ve shown emphasises, that doesn’t mean investing in cash long term is the answer. Doing so means giving up the extra return, wealth and opportunity that investing in multi-asset portfolios, rather than cash, bring over the long run. It’s incremental returns, compounded over time, that bring real potential in the future for investors. Those are the opportunities 7IM is focussed on.
1 We use the NYU datasets with data from 1928 as a long reference point, partly due to the ease of availability for long history US market information. We assume a multi asset portfolio is represented by a 60% equity (S&P 500 TR), 40% Bond (1py treasury) Portfolio versus cash represented by the 3 month US T-bill
2 For the analysis we have use the market GBP 20y swap rate, at the time of writing 4.3%


I confirm that I am a Financial Adviser, Solicitor or Accountant and authorised to conduct investment business.
If you do not meet this criteria then you must leave the website or select an appropriate audience.