
All-time highs, all the time
All-time highs have been getting a lot of airtime recently. A quick look at Google Trends will tell you that, this February, the web’s interest in the search term “all time high” smashed its previous all-time high.1
But why, all of a sudden, are people so interested?
Figure 1 – “all time high” Google search term interest
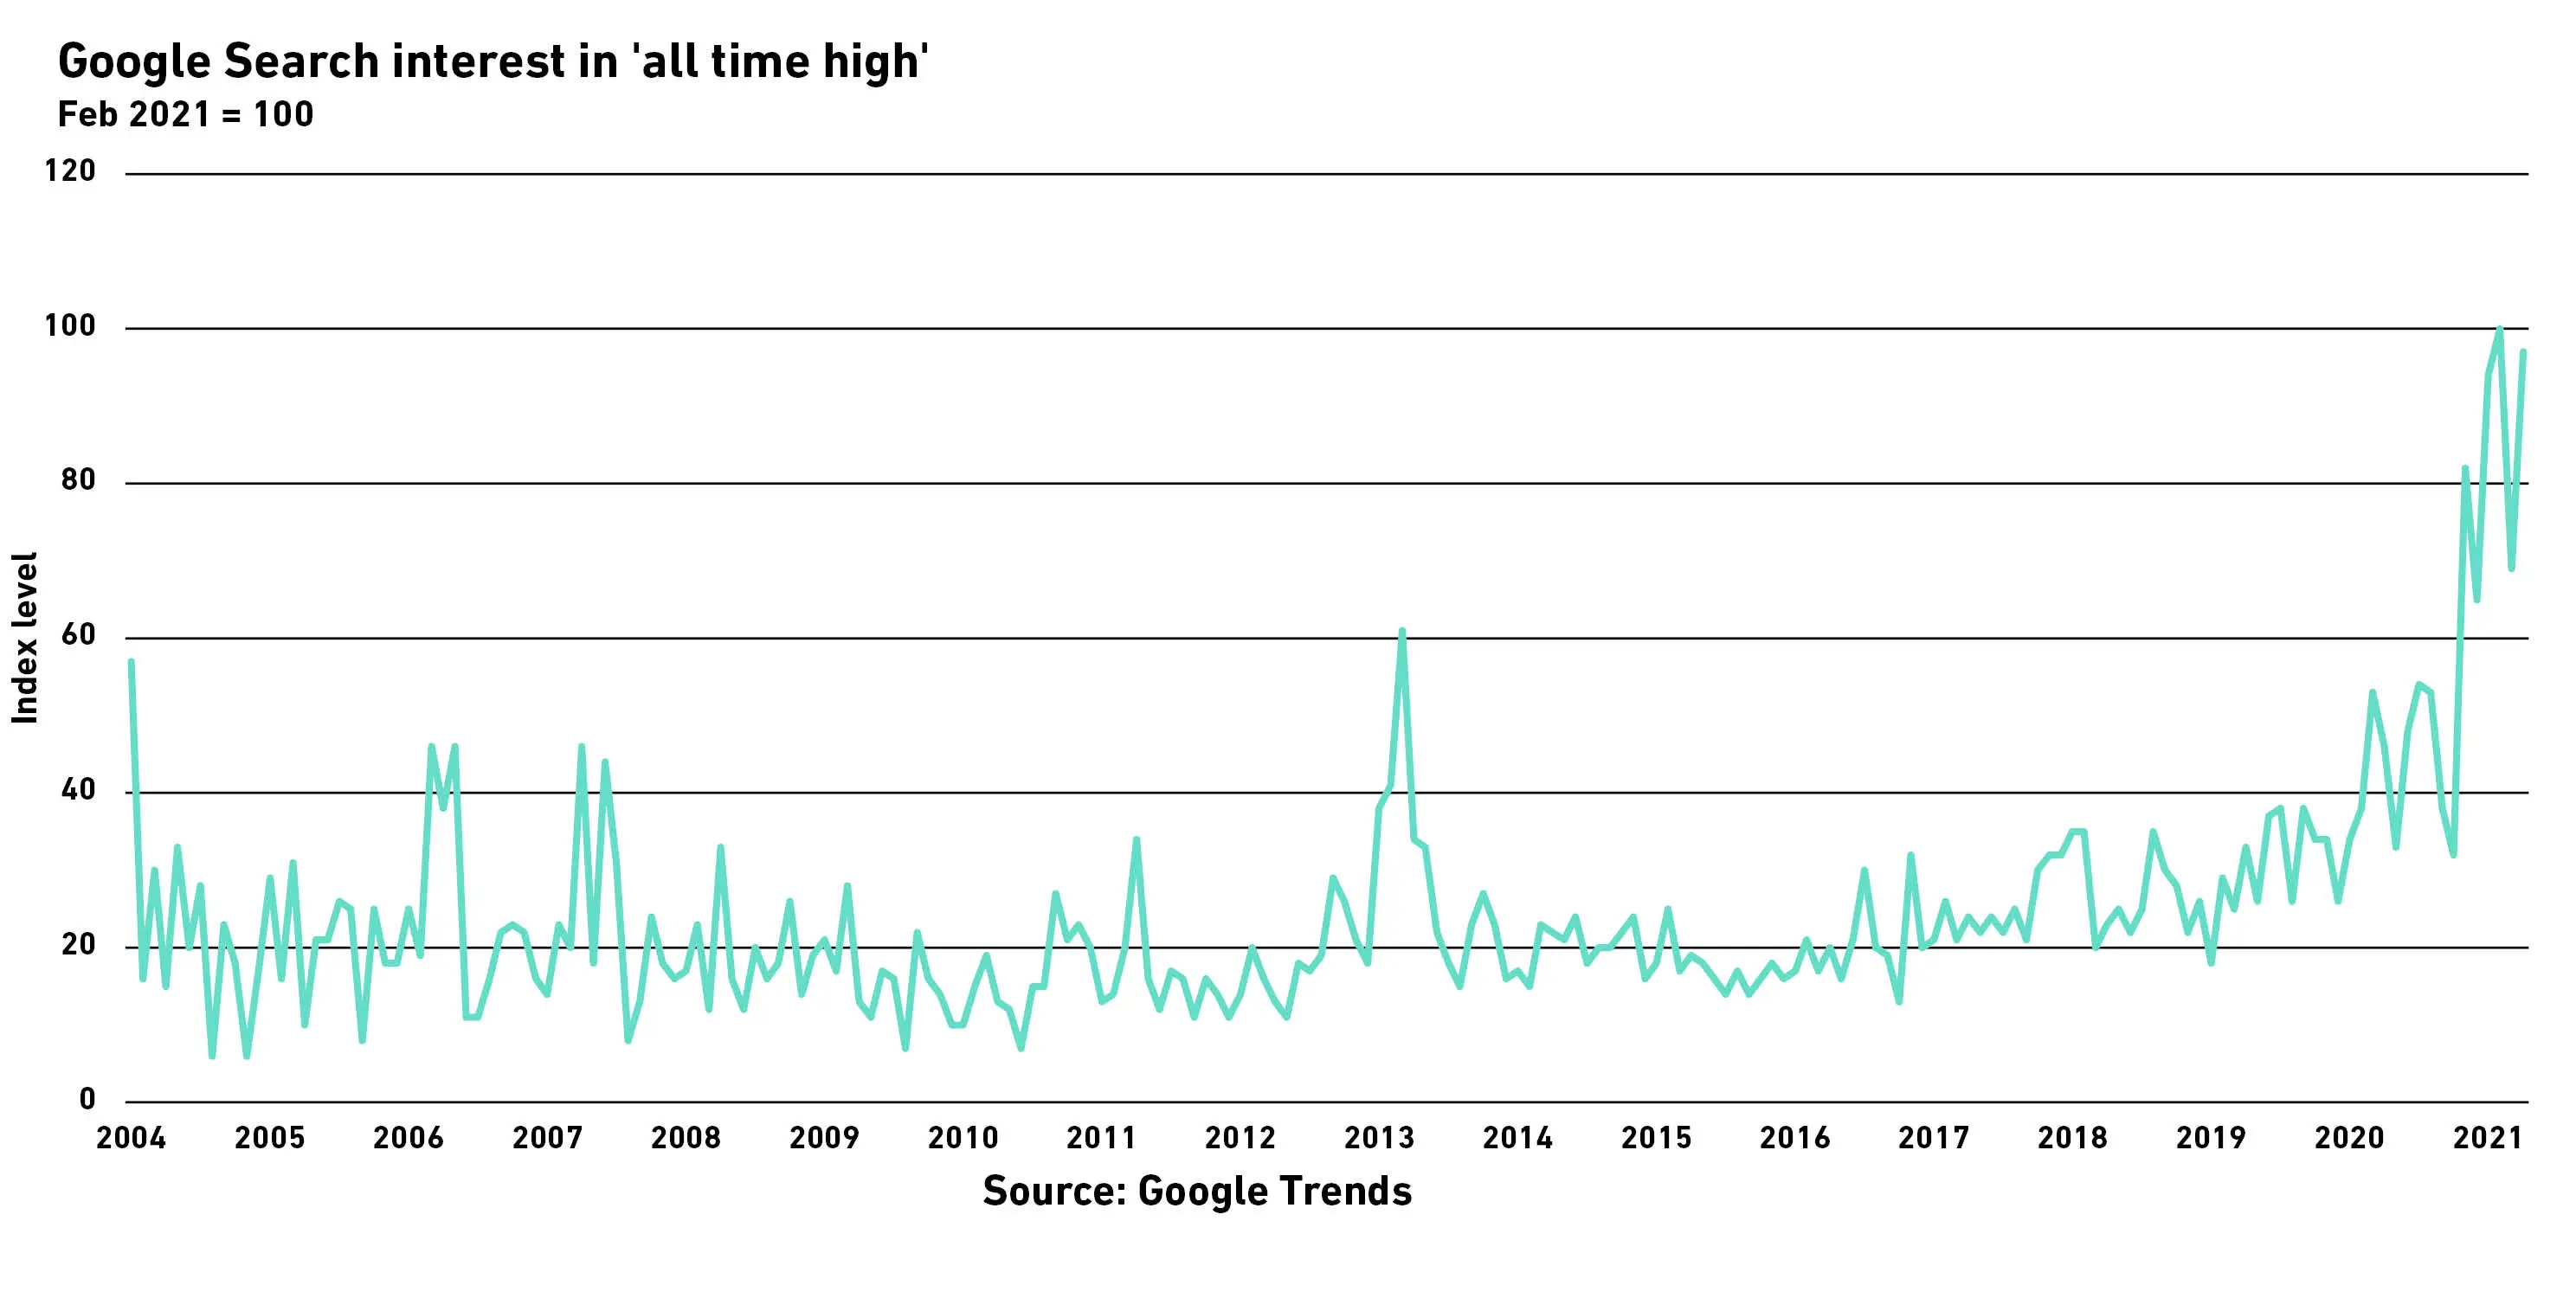
Google Trends also tells you the importance of related web queries to the original search. The key related search terms to “all time high” include “Dow Jones”, “S&P”, and “Nasdaq”; and it’s certainly true that the prices of these indices have hit all-time highs in the past few months.
Is the increased googling of “all time high” just a reflection of lockdown related boredom leading to more web searches? Or is something more sinister at play – will all-time highs lead to a market crash? Should we care?
In normal times, we should expect a lot of all-time highs, but why is this? Let’s start with the S&P 500 – the market cap weighted index of the prices of the 500 largest US listed companies. It includes many of the largest most successful living companies in the world. Much like other living things, companies tend to grow. They innovate, invent, and find efficiencies that help them get bigger and better over time. It’s a pretty normal state of affairs for markets to make all-time highs, this reflects the positive growth trend.
So why do investors get worried? They panic about dips, they forget about compounding, and they focus on short time horizons.
1. Most markets go up more than they go down
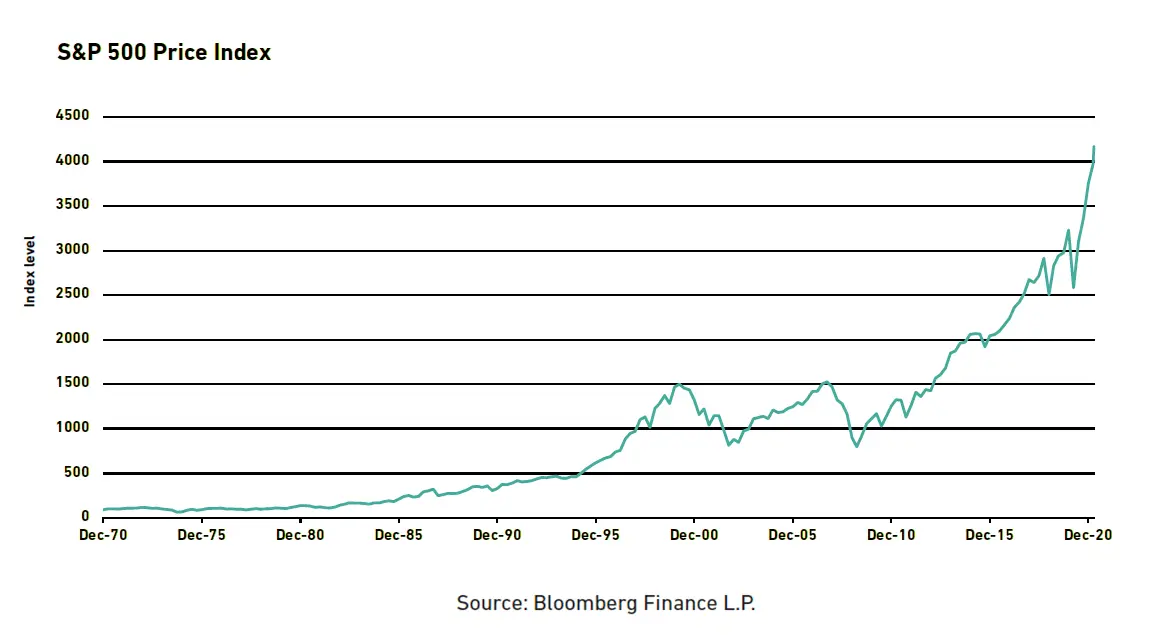
Historically, stock indices, on average, go up. The reason the “on average” is required is volatility. It’s not always a smooth journey – one day at all-time highs, the next day a small sell-off. Sometimes those bad days turn into bad years. But the point is that over time, those all-time highs keep happening. Life finds a way (to quote Dr Ian Malcolm from Jurassic Park).
Figure 2 is a graph of the S&P 500 over the past 30 years. There are a few bumps, but the upwards trend is clear…
Figure 2 – the S&P 500 index since 1970
2. Don’t forget about dividends
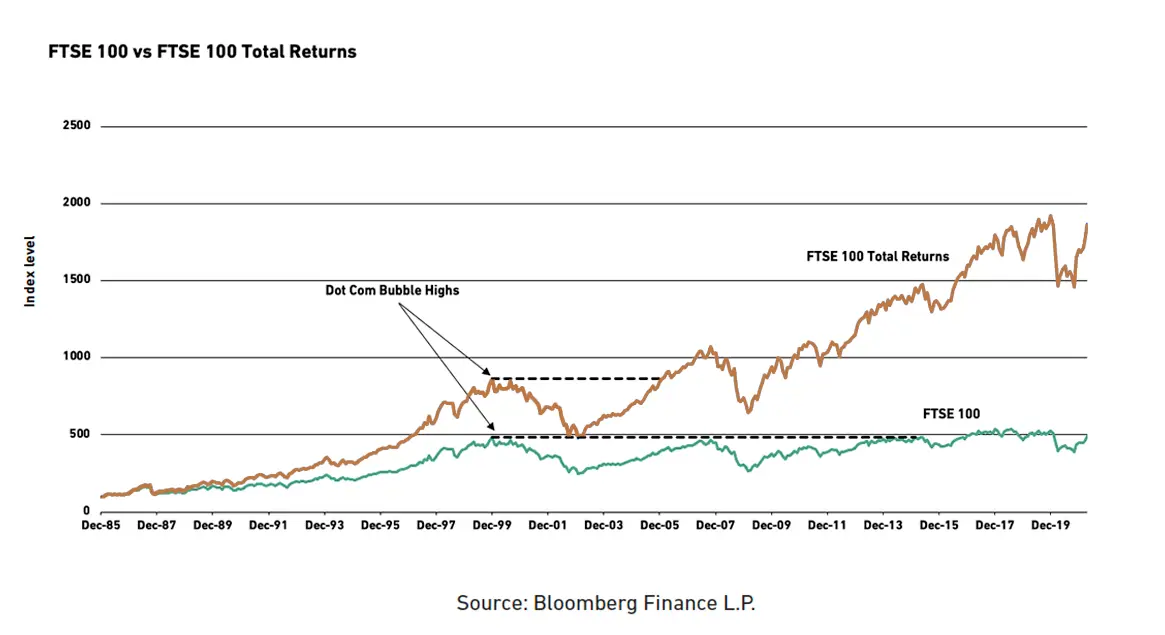
UK investors have a common gripe. The teal line in figure 3 shows the price of the FTSE 100, and although the index sort of goes up, some investors struggle to ignore the fact that they had to wait over 15 years for the index to get back to its Dot Com Bubble high of December 1999. For those who invested through the lull of highs, all-time highs in 1999 did feel like a bad signal.
But that ignores the key advantage of being a long-term investor: compounding up of dividends. Companies tend to make profits and reward shareholders through paying dividends. You can reinvest the dividends, and the new shares you buy with this dividend money will move with the market, and even pay more dividends!
Let’s apply this to the FTSE’s lull of all-time highs… if you reinvested your dividends, that 15-year lull would have felt very different. The orange line in figure 3 shows just that. Lo and behold, if you reinvested your dividends, the 1999 all-time high was topped in around 5 years and pretty much kept going up.
Figure 3 – FTSE 100 vs FTSE 100 if you reinvested your dividend (Total Returns)
3. What about the ones that haven’t gone up?
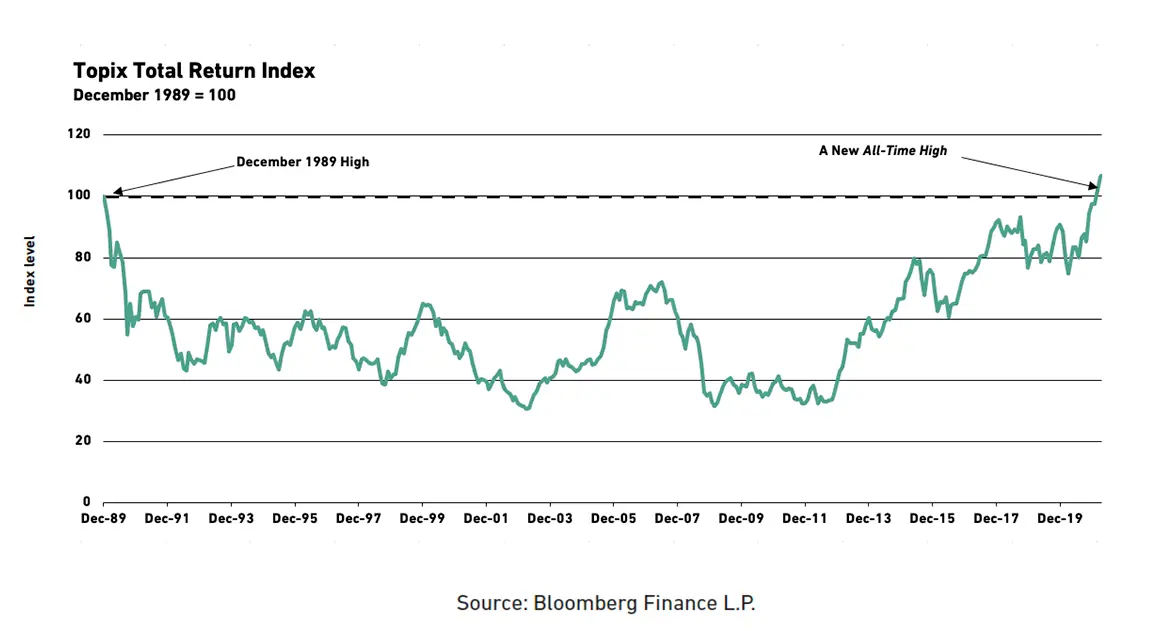
What about the worst case though? Of all the developed markets, Japan has had the roughest time by some stretch. In the early 90s, the mother of all bubbles burst, and Japanese stock market prices have never really recovered. On a price basis, the TOPIX index is still 30% below its 1989 peak. Japanese firms also pay famously low dividends. However, if you dig deeper, there is still an all-time high to be unearthed – with a long enough time horizon and reinvestment of dividends.
Even if you invested all your money in the TOPIX at the exact worst time (December 1989), you’d now have more Japanese Yen than you started with. Of course, that’s nearly a 35-year wait… which seems forever, but it’s shorter than most of our clients’ investment horizons:
Figure 4 – TOPIX with reinvested dividends breaking its old all-time high
So, what can we learn from all of this?
First, don’t be alarmed by all-time highs. Despite sometimes going down, markets tend to trend up. So, you should expect, and even hope for, all-time highs.
Second, if you’re wondering whether investing in a market is worth it, remember that what ends up in your pocket includes dividends, not just price changes.
Last, given that markets trend up, staying in the market is key. The volatility of markets is hard to read, but, provided that you don’t panic sell after they fall, you’re unlikely to go wrong.
1 https://trends.google.com/trends/explore?date=all&q=%22all%20time%20high%22

Discover more


I confirm that I am a Financial Adviser, Solicitor or Accountant and authorised to conduct investment business.
If you do not meet this criteria then you must leave the website or select an appropriate audience.