
Monthly commentary
It felt like 2026 entered the room by kicking the door down. We had US military intervention in a dysfunctional South American state, NATO infighting over Greenland and a burgeoning revolution in Iran.
More like the background for a Tom Clancy novel or a Tom Cruise film than reality, really – so no wonder cash kept flocking into what had helped them last year. Gold and silver, defence stocks, mining companies and semiconductors companies.
Money pouring in. Until, of course, it went the other way. As we got towards the end of the month, asset prices started jumping around a LOT.
Silver was the most extreme. Of the 21 trading days of January, the price of silver moved by more than 1% on 18 days! That’s very much not normal. An ounce of silver cost you $70 at the start of January, shot up to $80, back towards $70 again, before flying up to $100, then $115, back to $100, up again to $115, then ending the month at $78.
It’s a perfect real-life example of frequency of observation changing the experience of investing. If you had bought silver and spent January watching it every day (or worse, every hour), you’d have had a miserable time of it. Psychologically, you’d anchor on the $115 high point*. Sitting at $78 at the end of January, you’d feel like you missed your chance to sell.
But if you’d bought at the start of January, and only checked at the end of the month, you’d be up 12%. Much happier. Better still, if you’d have bought a year ago, and not looked, you’d be up more than 100%!
This isn’t to say buy silver (or gold)**. It’s to say that whatever you invest in, if you’re really in it for the long term, you’re best to act like it. Check it as infrequently as you can. Once a year is good. Once a decade is even better!
Chart of the Month
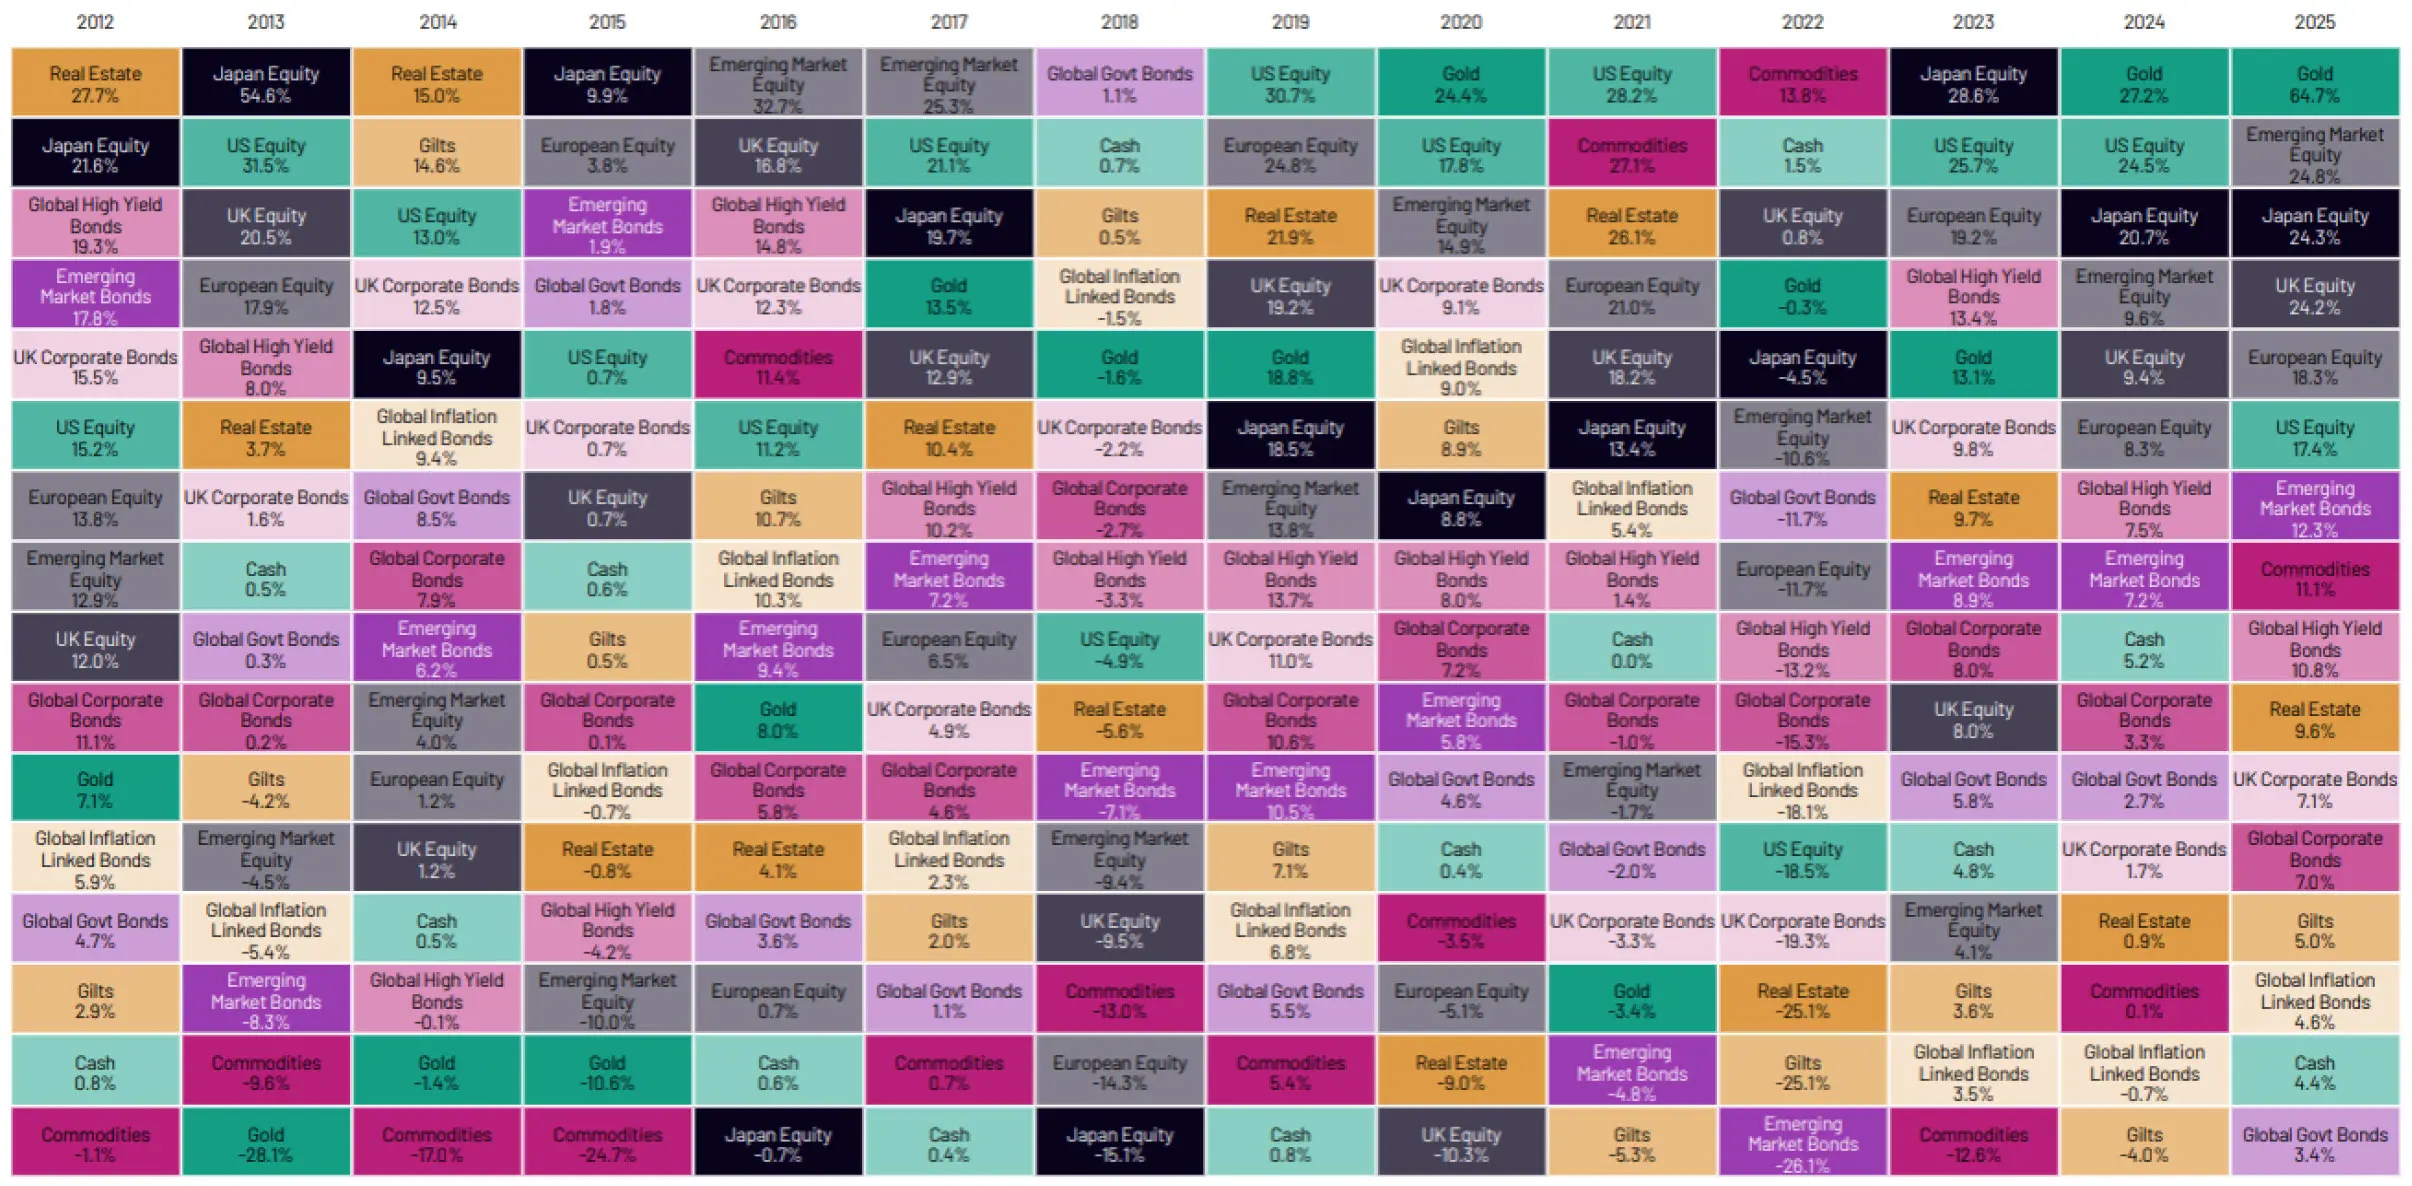
Performance is total return and in the local currency of the index, or hedged to GBP. The only exception to this is Emerging Market Equity, where returns are unhedged for a GBP investor. This is due to the cost and constraints on hedging Emerging Markets currency. Source: 7IM / Factset December 2025.
We are often asked about how to position for geopolitical uncertainty, and it’s a great question.
If you were to look into your crystal ball in January 2025 and see the plethora of geopolitical events that we experienced throughout the year, you would have thought it would have been a torrid time for markets. Yet, we saw a superb year for all major markets across asset classes, regions and sectors.
What the mosaic shows is that calendar years will be full of random events that no one can predict, but having a consistent, data-driven framework is key to cutting through the noise.
December Markets Wrap
The start of 2026 didn’t disappoint on the excitement front, with strong markets offsetting an array of geopolitical risks rearing their unfortunate heads across the globe. From the extraction of Venezuela’s President to the concerns around the Federal Reserve’s next Chairman, there was enough to keep market participants and commentators busy.
In equities, all major markets added another positive month on top of their strong 2025. Positive surprises in economic data, particularly in US employment, powered risk assets on to some experiencing all time highs. Corporate earnings allowed equities to kick on, with the S&P 500 flirting with 7,000 for the first time and the FTSE 100 breaking through the 10,000 ceiling.
The fixed income world was quiet in most areas, as bonds should be in a middling interest rate environment, with low inflation. The exception was Japan, where the continued political rollercoaster (in some circles, Japan’s Prime Minister is being compared to Liz Truss) led to Japanese Government Bond yields rising aggressively, given the potential for further tax cuts.
The real talking point for the month was the historic rise in precious metals (even with a reversal at the end of the month), with gold having its best month since 1999 and silver experiencing a ninth consecutive month of positive gains.
Market Movers
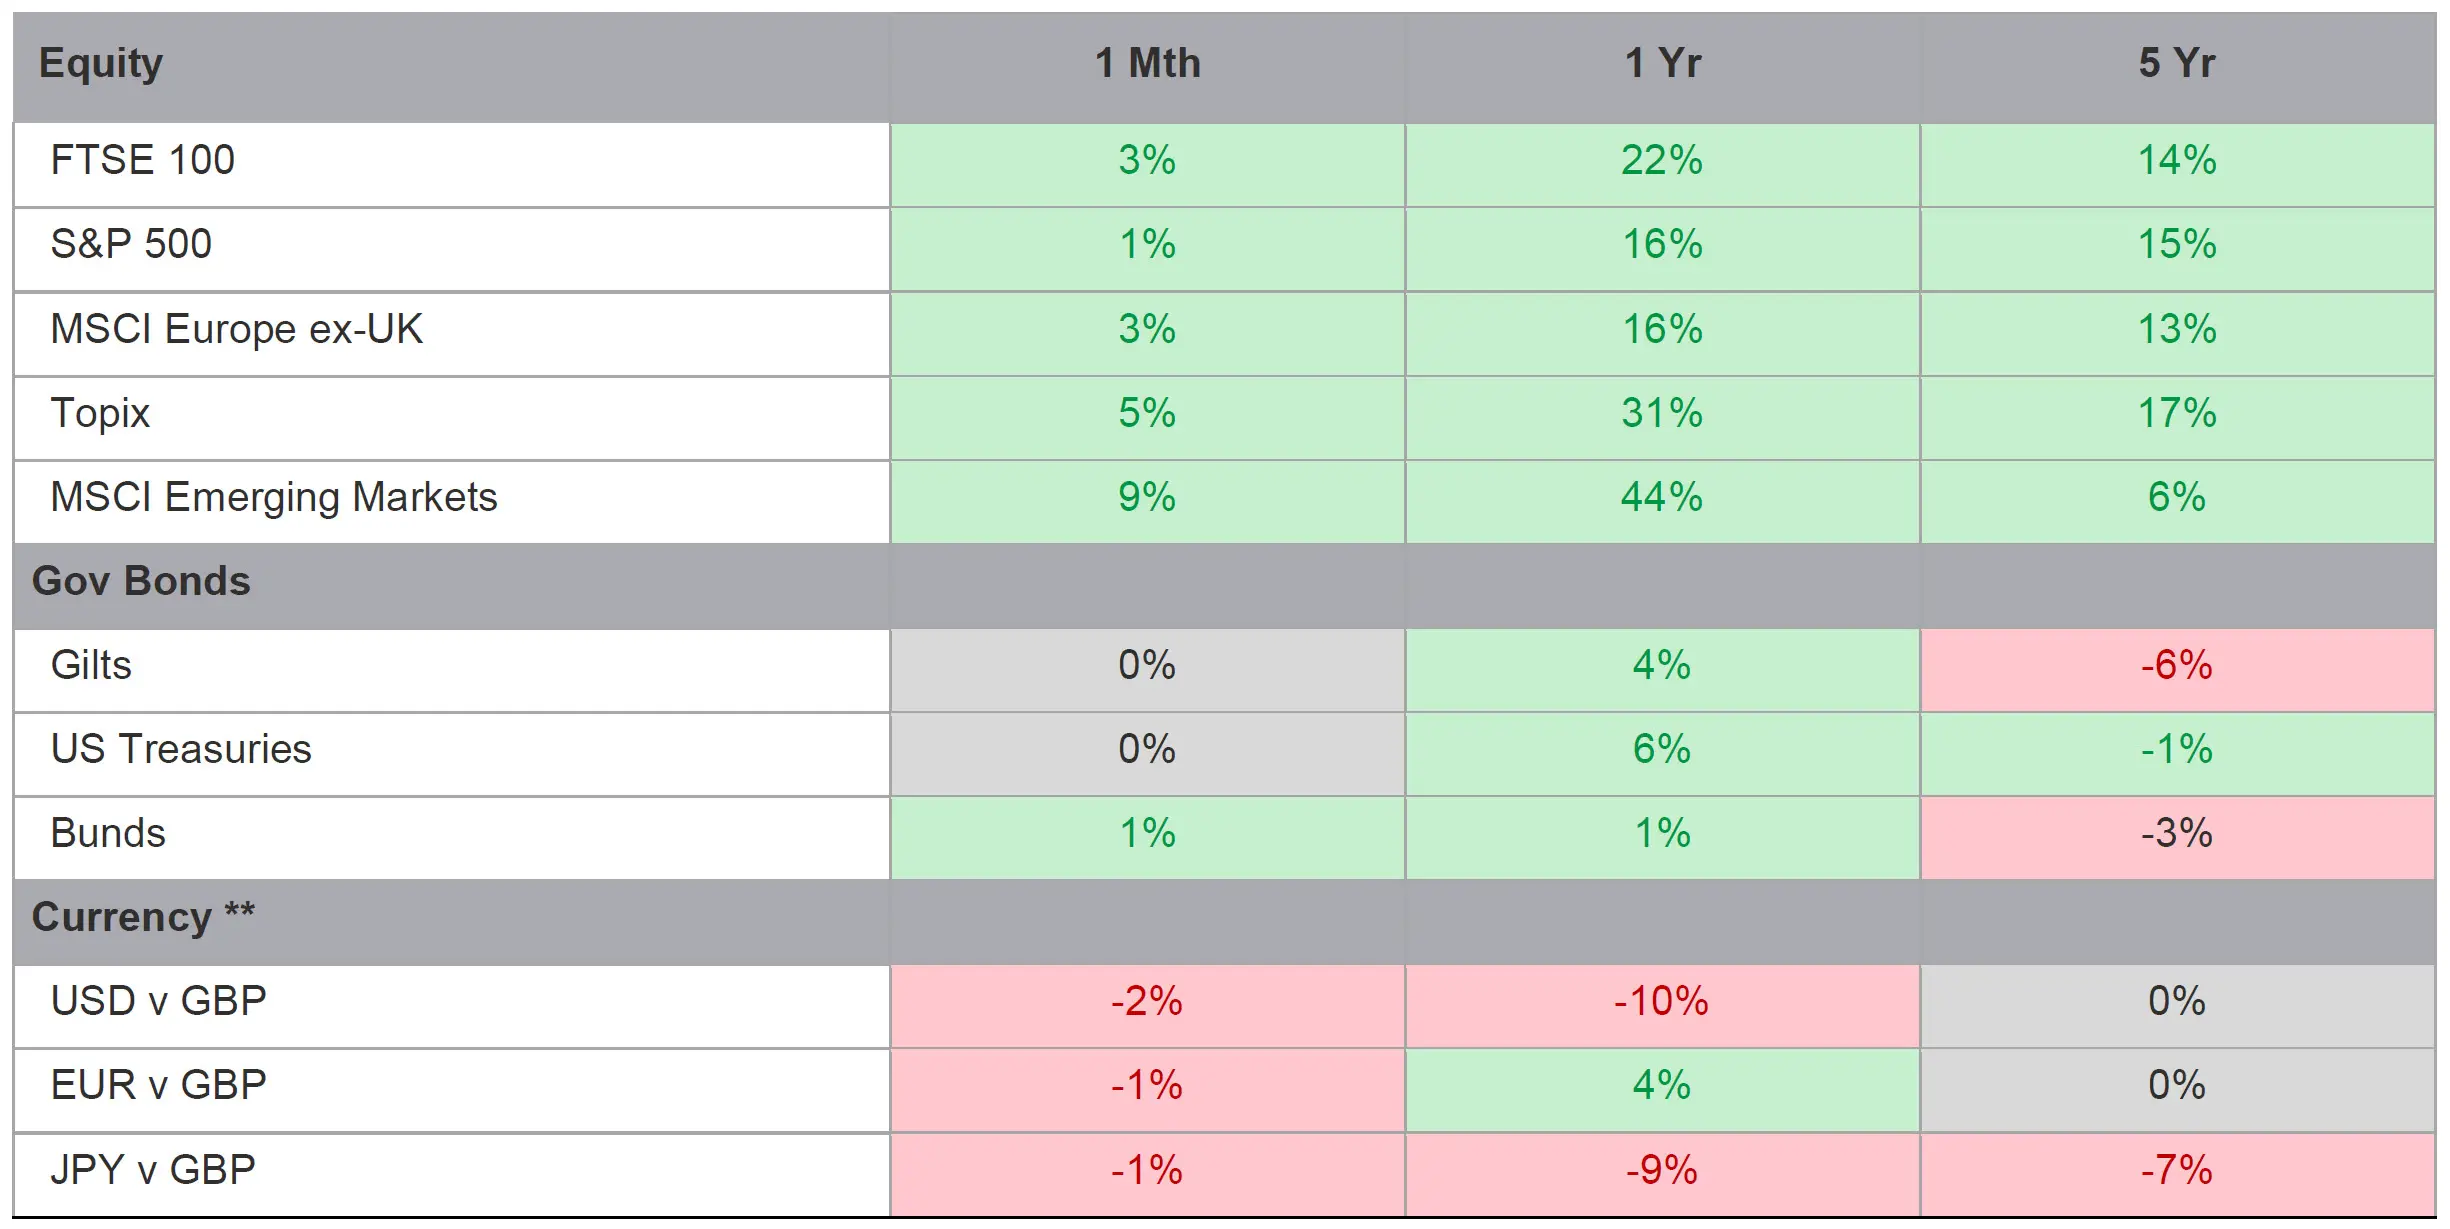
Source: Bloomberg Finance L.P. Data as of 31 January 2026. Past performance is not a guide to future returns. Quoted returns are in the local currency of the market.
What we’re watching in February
- 5th February – Bank of England meeting. Is there enough in the data to allow further rate cuts in the UK?
- 10th February – Q4 US Retail Sales. A real key indicator of how strong the US consumer looks is how much they spend over Christmas. Will 2025 be a record-breaking year for spending?
- 25th February – Nvidia results have now become the market event. How will the chip group fare going into 2026?
*Something called the peak-end effect means we remember highpoints and endpoints best.
**We actually don’t think they make sense for most portfolios; too volatile, no cash flows, and with too little reliability. We’ve done the work!

More from 7IM


I confirm that I am a Financial Adviser, Solicitor or Accountant and authorised to conduct investment business.
If you do not meet this criteria then you must leave the website or select an appropriate audience.